Note: The keyboard shortcuts displayed in the illustrations and in the text are the default hotkeys. You can customize and set those as per your choice as described in detail in the Linguistic Toolbox Check topic. As a general rule, in MacOS the Cmd/Command key in Apple Keyboards is used instead of the Windows keyboard Control key. So, e.g., the Windows hotkey Ctrl+G is in MacOS (Apple keyboard) Cmd+G.
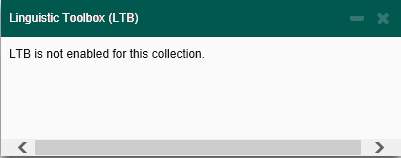
You can run the Linguistic Toolbox check only when LTB is enabled for the current collection. In such cases, when you select Linguistic Toolbox (LTB) in the Tools menu, the Linguistic Toolbox (LTB) dialog is displayed, and the Run LTB button is disabled.
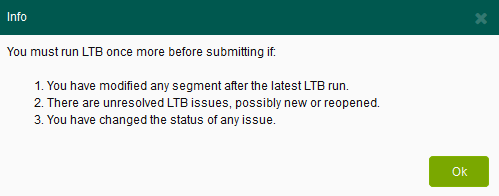
If the Force LTB Check option is enabled in TMS for the CTE collection, you must run LTB and have it completed with zero unmarked issues immediately before submitting the collection (no segment or issue changes can be made in between). If you try to submit a collection without having just run LTB, even if there are 0 unmarked issues, an error is displayed, and you are told to re-run LTB before submitting. If this setting is not enabled for the collection (it is disabled by default), you are free to submit your collection at any time. You should, however, try to mark each issue with a status.
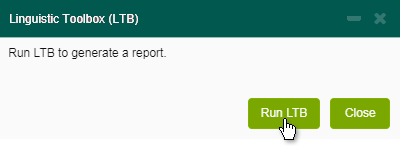
When LTB is enabled for the collection, click the Run LTB button, or press Alt+F11 to start the LTB check.
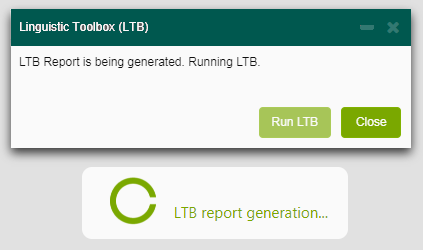
Linguistic Toolbox creates a report on the current Collection, which CTE loads to TMS when the collection is completed. While the report is generated, the following dialog is displayed.
When the report has been generated, you can filter the results by using the selectors in the Linguistic Toolbox (LTB) dialog. You can filter the viewable segments based on the Category of the issues, their Severity level, and the Confidence for the issue being true. The dialog also displays statistics for the total number of issues, and the number of issues in each state, as well as the date and time of the last LTB run. You can close this window and return to it at any time to use the filters, view the statistics, or rerun LTB to generate an updated report.
|
|
Category = Text identifying the type of match found, for example: A - Incorrect Meaning |
|
Severity = Numerical value indicating the degree of severity for a given issue. The higher the number, the more severe the issue is. |
|
|
Confidence = Numerical value indicating the degree of confidence for a given issue, Higher number indicates more confidence. |
|
|
|
Status = Value indicating the status of the segment. |
When the LTB window is displayed, the main CTE filter changes to “LTB Filter”. When you select this filter, the LTB filters in the LTB window are enabled, and only segments with LTB issues are displayed. If the user wants to view all segments including those without any LTB issues, they can change the main CTE filter back to “None”.
You can use the following keyboard shortcuts for LTB UI controls:
Segments with at least one LTB issue have a red exclamation mark icon in the collection view.

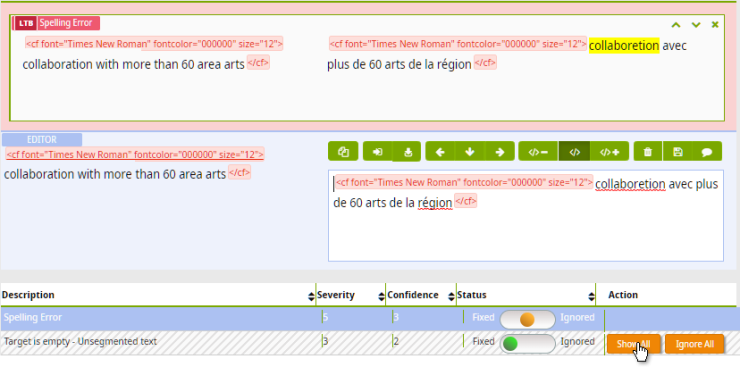
If you open a segment with LTB issues, the issues are listed below the segment editor. There you can view the description, confidence, severity, and status of each issue on this segment. Hover over a truncated description to display the whole description. The Confidence and Severity columns match the confidence and severity filters in the LTB window.
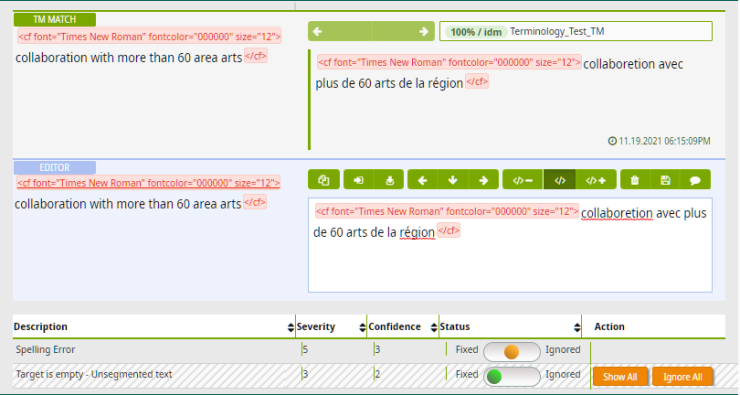
When you select an issue, its details are displayed in the top half of the segment editor. Those text passages are highlighted in the source or target segment which LTB finds relevant to the issue stated in the Description.
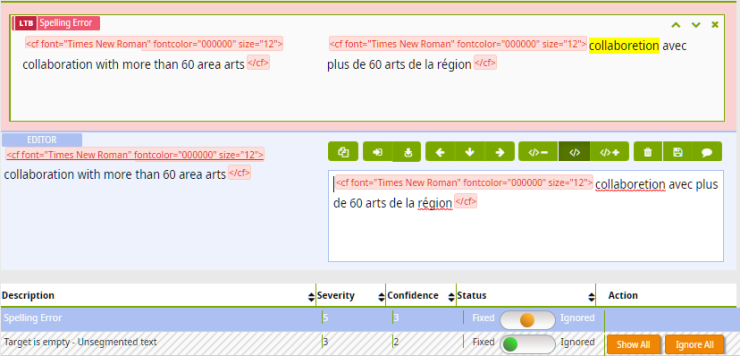
You must set a status for each LTB issue. If you fix the issue, you should toggle the switch to Fixed. If the issue is a false positive, you should toggle the switch to Ignored. You must save the segment for any issue status changes to persist. Changes in issue statuses are reflected in the statistics in the LTB window.
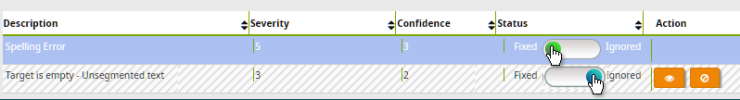
Any issues that already have their status set are displayed with a grayed-out background for you to easier view which issues still require action. If any, the first row requiring action from the LTB issue list is automatically selected.
When all issues on a segment have a status, the icon in the collection view changes to a green check-mark.

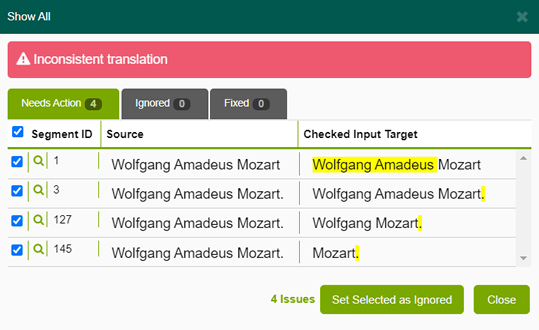
Some issues may have Show All and Ignore All action buttons in the issue list. This indicates that LTB has found multiple issues of the same type (having the same Description) on other segments in the collection. If the issues are identical, you can click Ignore All to set all occurrences to Ignored throughout the collection. In some cases, however, it is not safe to do this without viewing the specific segments with their highlighted text, so Ignore All is disabled, and you must click Show All to decide which ones to mark Ignored.
The Show All dialog displays all the issues from the issue group (i.e., which have the same Description). There are three tabs at the top: Needs Action, Ignored, and Fixed. Each tab displays the issues with that status, as well as a count. You can use checkboxes to select which issues to ignore and click on the Set Selected as Ignored to mark them all as ignored (all checkboxes are initially selected by default). You can click the spyglass icon next to each segment to jump to that segment and fix it immediately.
At any time, the user can choose to re-run LTB, which will update the issues to reflect their current status. Ignored issues will still be marked Ignored. Fixed issues will only be marked Fixed if they are no longer found by LTB. If an issue marked Fixed is still present, it becomes unmarked when you re-run LTB. Any new issues that are found will be unmarked. When the re-run is complete, the statistics will be updated to reflect the new state.
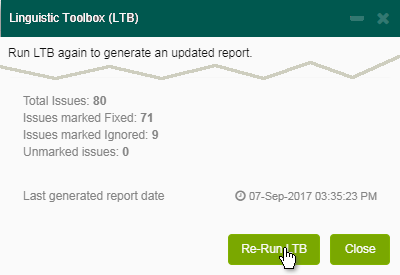
In this case, there were 71 fixed issues and 9 ignored issues before re-running. After re-running, there are 70 fixed, 9 ignored, and 2 unmarked. This means that LTB found one issue the user had marked Fixed was still present and found one entirely new issue.
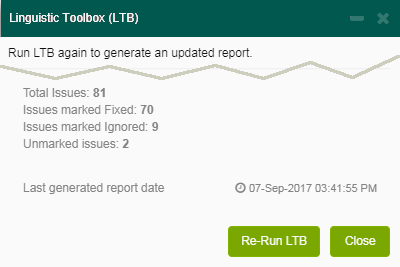
You should then fix these two new issues (or ignore them if they are false positives). When you do that, the unmarked issue count will again be zero.

For information on filtering the segments see the Filtering Segments topic.
For information on Term Search see the Term Search topic.
For information on adding and viewing comments see the Comments topic.
For information on Concordance Search see the Concordance Search topic.
For information on submitting the translations see the Submitting a Collection topic.
